
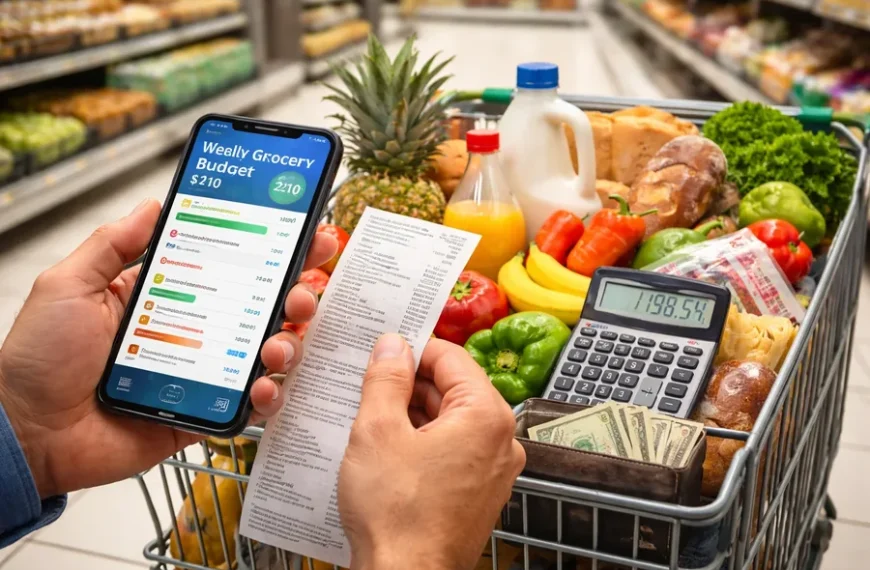
Bill Bengen, the financial planner who devised the 4% withdrawal rule back in 1994, has told CNBC that inflation is the single biggest structural threat to a retirement plan. Groceries are where most households feel that threat first, week after week, in a way no portfolio statement ever captures.
That’s the whole idea behind the grocery receipt test. Your weekly food spending is the closest thing you have to a live feed of what retirement will actually cost, and it tends to disagree with the tidy replacement-rate math most people rely on. The question is which of those two signals you should trust when you set your retirement income number.
The Replacement-Rate Rule Is Clean, and That’s the Problem
The standard approach starts with your paycheck. A common planner rule of thumb says you’ll need roughly 70% to 80% of your pre-retirement income to keep your lifestyle intact, because payroll taxes disappear, retirement contributions stop, and housing costs often shrink.
The math is clean. It’s also abstract, and it tells you almost nothing about what a Tuesday will feel like when the cart holds the same items it held five years ago and the total is meaningfully higher. A percentage of your old salary is a target, not a forecast.
The Receipt Is Messy, and That’s Why It Works
A receipt shows what a week actually costs you right now. Multiply by 52 and you have a real annual number for one of the categories retirees consistently rank near the top of their budgets, behind housing and roughly alongside transportation and healthcare.
It also picks up things a replacement rate can’t see: whether you cook or eat out, whether you buy for one or four, and whether your tastes lean toward the aisles where prices are moving fastest. That’s information a paycheck-based estimate throws away.
The Two Views Disagree Most on Food Inflation
Grocery prices don’t move at headline CPI, and inside the grocery basket some categories move much faster than others. Beef, eggs, and coffee have spent recent years well above the general trend, and staples-heavy households feel that unevenly.
A replacement rate assumes yesterday’s spending, inflated by a smooth average, still describes tomorrow. A receipt refuses that assumption and shows you the actual mix your retirement income has to cover.
Run the Test on Yourself This Month
The exercise is deliberately low-tech. You don’t need a spreadsheet or an app. Four weeks of receipts and a calculator will do it.
- Save every food receipt. Include groceries, restaurants, coffee, and delivery. If you paid for food, it counts.
- Add up four weeks. A single week is noise. A month starts to show your real pattern.
- Multiply by 13. That gives you an annual food number grounded in what you actually buy, not what a percentage suggests you should.
- Compare it to your replacement-rate estimate. If the receipt number comes in meaningfully higher, your plan is probably underweighting food and, by extension, inflation-sensitive categories in general.
Each Approach Wins at a Different Stage
The replacement rate is the better tool early on, when retirement is 15 or 20 years out and the specifics don’t exist yet. It gives you a savings target you can actually work toward.
The receipt test wins as you get closer. Inside a decade of retirement, your real spending patterns are more predictive than any percentage of a salary you may not earn much longer. This is also where a financial advisor earns their keep, pulling the two views together with your tax picture, Social Security timing, and withdrawal strategy so the number you retire on reflects the life you actually spend money on.
Keep the receipts. They’re telling you something a spreadsheet never will.


