You may have observed that some stocks rise continuously while others struggle to move despite positive news. This happens due to differences in stock strength. Most experienced traders don’t rely on the news or financial statements. They try to gauge the stock strength by looking at price charts.
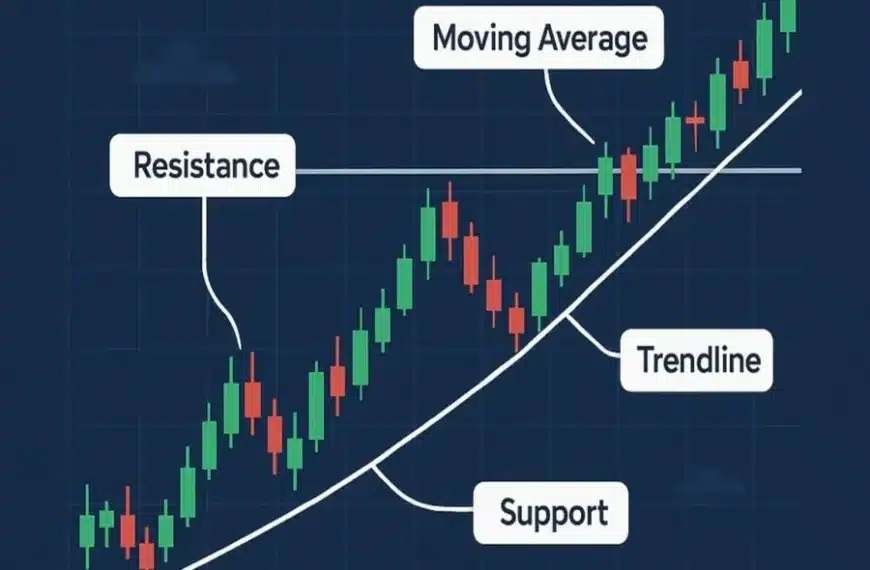
You can get a visual representation of supply and demand through charts, showing who is in control: buyers or sellers. By analysing trends, volume, support and resistance levels, and technical indicators, traders can gauge the genuineness of the stock strength. This article will help you understand how traders use charts to confirm stock strength.
What does “stock strength” mean?
Stock strength refers to a stock’s ability to sustain upward momentum with steady buying interest. Below are some key characteristics of a strong stock:
- Strong stock forms higher highs and higher lows.
- It shows steady demand during pullbacks.
- A strong stock mostly performs better than the broader market.
Also, sometimes a strong stock remains strong despite the weaker broader market. Conversely, weak stocks may struggle even when the broader market is rising. By analysing the price chart, traders visually identify the strength using price behaviour, momentum, and participation levels.
Steps to analyse a stock’s strength
There are broadly five steps through which you can analyse the stock’s strength.
-
Analysing trend structure
A strong stock in an uptrend forms higher highs and higher lows. This signals that buyers are interested in buying at even higher prices. A weak stock usually forms lower highs and lower lows. For trend confirmation, traders usually use moving averages. Prices staying above the 50 EMA line represent short to medium-term strength, and prices staying above the 200 EMA line signal long-term bullish structure.
An additional characteristic of a strong stock is that it normally respects key moving averages during pullbacks. A consistent bounce from key moving averages shows sustained demand. Finding higher highs and higher lows aids traders in determining whether buyers are in control when examining stocks such as the HDFC Bank share price or any other large-cap stock.
-
Volume confirmation
Volume plays a crucial role in strength confirmation. When volume increases during rising prices, it indicates strong buying participation and possible institutional interest. Rising prices with decreasing volume signal weak momentum. Also, a breakout with low volume generally fails.
To summarise, strong price movement with strong volume validates stock strength. Many traders use a technical screener to filter stocks showing high volume breakouts, strong RSI readings, or price trading above key moving averages before analysing charts in detail.
-
Support and resistance behaviour
Strong stocks behave differently near key price zones, like support and resistance. They break resistance decisively and convert previous resistance into new support. Also, strong stocks show shallow pullbacks before continuing upward.
The phenomenon of converting resistance into support and vice versa is known as role reversal. When old resistance becomes support, it indicates buyers are willing to defend higher price levels.
-
Using indicators to confirm strength
Along with price action, traders also use indicators to get confirmation on stock strength. They primarily use the following indicators.
-
RSI (Relative Strength Index)
RSI measures momentum. During a strong uptrend, the RSI stays above 60 and finds support between 40 and 50. A steady RSI above 50 represents a bullish trend.
-
Moving Averages
Price trading above key moving averages like the 50 EMA and the 200 EMA, for a long duration, represents a bullish trend with momentum. Also, crossovers, such as the 50 EMA crossing above the 200 EMA, may indicate strengthening momentum.
-
Relative Strength (RS)
Relative strength compares a stock’s performance to an index. If a stock is outperforming the broader market, it reflects leadership and strength.
-
Multi-timeframe analysis
Professional traders always check the stock with different timeframes. To determine the general trend direction, they begin with a longer timeframe (weekly or daily). Then, they refine entries using shorter timeframes (hourly or 4-hour charts).
Stronger confirmation of stock strength is provided by alignment over several time periods.
Conclusion
A stock strength analysis is an important step before investing or trading. Traders can validate stock strength by analysing trend, volume confirmation, observing support and resistance levels, and using indicators. Strong stocks leave clear footprints — higher highs, strong breakouts, healthy pullbacks, and solid volume participation.


